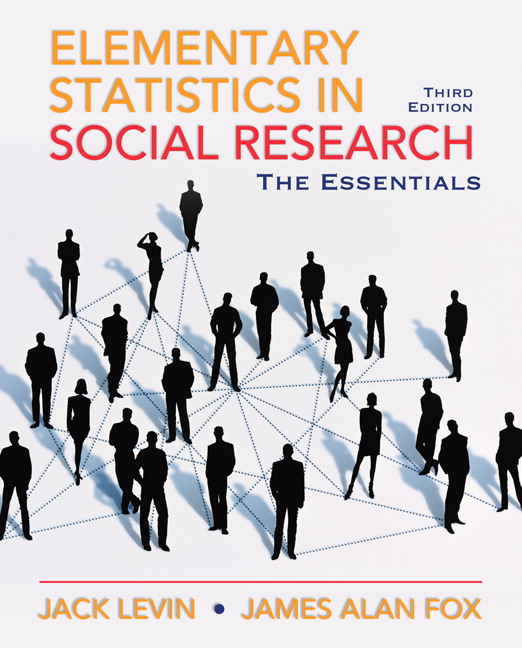
Solution Manual and Test Bank for Elementary Statistics in Social Research: Essentials, 3/E 3rd Edition Jack A. Levin, James Alan Fox
$35.00 Original price was: $35.00.$26.50Current price is: $26.50.
Solution Manual and Test Bank for Elementary Statistics in Social Research: Essentials, 3/E 3rd Edition Jack A. Levin, James Alan Fox
Solution Manual and Test Bank for Elementary Statistics in Social Research: Essentials, 3/E 3rd Edition Jack A. Levin, James Alan Fox digital download immediately after payment is complete.

Product details:
- ISBN-10 : 0205638007
- ISBN-13 : 978-0205638000
- Author: Jack Levin
This text provides a streamlined and accessible introduction to statistics for students in sociology, criminal justice, political science, social work, and other social sciences.
This text offers an essential and accessible overview to the introduction to social statistics. Clearly written with detailed step-by-step illustrations of statistical procedures, this text provides clear and logical explanations for the rationale and use of statistical methods of social research. Numerous end-of-chapter questions in every chapter reinforce key concepts to students.
Table contents:
Why the Social Researcher Uses Statistics
1(22)
The Nature of Social Research
1(2)
Why Test Hypotheses?
3(1)
The Stages of Social Research
4(1)
Using Series of Numbers to Do Social Research
5(7)
The Functions of Statistics
12(6)
Summary
18(1)
Questions and Problems
18(3)
Looking at the Larger Picture: A Student Survey
21(2)
PART I Description
23(66)
Organizing the Data
25(33)
Frequency Distributions of Nominal Data
25(1)
Comparing Distributions
26(1)
Proportions and Percentages
26(2)
Simple Frequency Distributions of Ordinal and Interval Data
28(1)
Grouped Frequency Distributions of Interval Data
29(2)
Cumulative Distributions
31(2)
Dealing with Decimal Data
33(2)
Flexible Class Intervals
35(2)
Cross-Tabulations
37(6)
Graphic Presentations
43(7)
Summary
50(1)
Questions and Problems
51(7)
Measures of Central Tendency
58(14)
The Mode
58(1)
The Median
59(1)
The Mean
60(2)
Taking One Step at a Time
62(1)
Comparing the Mode, Median, and Mean
62(1)
Box 3.1 Step-by-Step Illustration: Mode, Median, and Mean
63(4)
Summary
67(1)
Questions and Problems
68(4)
Measures of Variability
72(17)
The Range
73(1)
The Variance and the Standard Deviation
74(1)
Step-by-Step Illustration: Standard Deviation
75(1)
The Raw-Score Formula for Variance and Standard Deviation
76(1)
Step-by-Step Illustration: Variance and Standard Deviation Using Raw Scores
77(1)
The Meaning of the Standard Deviation
78(3)
Comparing Measures of Variability
81(1)
Summary
82(1)
Questions and Problems
82(3)
Looking at the Larger Picture: Describing Data
85(4)
PART II From Description to Decision Making
89(60)
Probability and the Normal Curve
91(27)
Probability
92(1)
Probability Distributions
93(3)
The Normal Curve as a Probability Distribution
96(1)
Characteristics of the Normal Curve
97(1)
The Model and the Reality of the Normal Curve
97(2)
The Area under the Normal Curve
99(6)
Standard Scores and the Normal Curve
105(2)
Finding Probability under the Normal Curve
107(1)
Step-by-Step Illustration: Probability under the Normal Curve
108(5)
Step-by-Step Illustration: Finding Scores from Probability Based on the Normal Curve
113(1)
Summary
114(1)
Questions and Problems
114(4)
Samples and Populations
118(31)
Random Sampling
119(1)
Sampling Error
120(1)
Sampling Distribution of Means
121(7)
Standard Error of the Mean
128(1)
Confidence Intervals
129(4)
The t Distribution
133(5)
Step-by-Step Illustration: Confidence Interval Using t
138(2)
Estimating Proportions
140(1)
Step-by-Step Illustration: Confidence Interval for Proportions
141(1)
Summary
142(1)
Questions and Problems
143(3)
Looking at the Larger Picture: Generalizing from Samples to Populations
146(3)
PART III Decision Making
149(102)
Testing Differences between Means
151(40)
The Null Hypothesis: No Difference between Means
153(1)
The Research Hypothesis: A Difference between Means
154(1)
Sampling Distribution of Differences between Means
154(4)
Testing Hypotheses with the Distribution of Differences between Means
158(4)
Levels of Significance
162(4)
Standard Error of the Difference between Means
166(1)
Testing the Difference between Means
167(2)
Step-by-Step Illustration: Test of Difference between Means
169(2)
Comparing Dependent Samples
171(1)
Step-by-Step Illustration: Test of Difference between Means for Same Sample Measured Twice
172(3)
Step-by-Step Illustration: Test of Difference between Means for Matched Samples
175(2)
Two Sample Test of Proportions
177(1)
Step-by-Step Illustration: Test of Difference between Proportions
177(2)
Requirements for Testing the Difference between Means
179(1)
Summary
180(1)
Questions and Problems
181(10)
Analysis of Variance
191(24)
The Logic of Analysis of Variance
192(2)
The Sum of Squares
194(1)
A Research Illustration
195(5)
Mean Square
200(1)
The F Ratio
201(3)
Step-by-Step Illustration: Analysis of Variance
204(4)
Requirements for Using the F Ratio
208(1)
Summary
208(1)
Questions and Problems
209(6)
Nonparametric Tests of Significance
215(36)
One-Way Chi-Square Test
216(3)
Step-by-Step Illustration: One-Way Chi-Square
219(1)
Two-Way Chi-Square Test
220(6)
Two-Way Chi-Square Test of Significance
226(4)
Step-by-Step Illustration: Comparing Several Groups
230(6)
The Median Test
236(1)
Step-by-Step Illustration: Median Test
236(3)
Summary
239(1)
Questions and Problems
239(9)
Looking at the Larger Picture: Testing for Differences
248(3)
PART IV From Decision Making to Association
251(66)
Correlation
253(19)
Strength of Correlation
253(1)
Direction of Correlation
254(1)
Curvilinear Correlation
255(1)
The Correlation Coefficient
256(1)
Pearson’s Correlation Coefficient
257(6)
Step-by-Step Illustration: Pearson’s Correlation Coefficient
263(2)
Summary
265(1)
Questions and Problems
266(6)
Regression Analysis
272(18)
The Regression Model
273(5)
Interpreting the Regression Line
278(2)
Regression and Pearson’s Correlation
280(1)
Step-by-Step Illustration: Regression Analysis
281(2)
Summary
283(1)
Questions and Problems
283(7)
Nonparametric Measures of Correlation
290(27)
Spearman’s Rank-Order Correlation Coefficient
290(5)
Step-by-Step Illustration: Spearman’s Rank-Order Correlation Coefficient
295(3)
Goodman’s and Kruskal’s Gamma
298(1)
Step-by-Step Illustration: Goodman’s and Kruskal’s Gamma
299(3)
Correlation Coefficient for Nominal Data Arranged in a 2×2 Table
302(2)
Correlation Coefficients for Nominal Data in Larger than 2×2 Tables
304(3)
Summary
307(1)
Questions and Problems
307(8)
Looking at the Larger Picture: Measuring Association
315(2)
PART V Applying Statistics
317(32)
Choosing Statistical Procedures for Research Problems
319(30)
Research Situations
323(17)
Research Solutions
340(9)
APPENDIXES
349(28)
Appendix A Instructions for Using ABCalc
351(4)
Appendix B A Review of Some Fundamentals of Mathematics
355(5)
Appendix C Tables
360(12)
Appendix D List of Formulas
372(5)
People also search:
elementary statistics in social research essentials (3rd edition) pdf
elementary statistics topics
social studies essential elements
elementary statistics for the behavioral and social sciences
Related products
Solution Manual
Solution Manual
Solution Manual
Solution Manual
International Accounting Doupnik 4th Edition Solutions Manual
Solution Manual
Solution Manual
Management Information Systems Managing the Digital Firm Laudon 14th Edition Solutions Manual


