Test Bank for Business Statistics in Practice, 6th Edition: Bowerman
$35.00 Original price was: $35.00.$26.50Current price is: $26.50.
Test Bank for Business Statistics in Practice, 6th Edition: Bowerman
Instant download Test Bank for Business Statistics in Practice, 6th Edition: Bowerman pdf docx epub after payment.
Product details:
- ISBN-10 : 0073401838
- ISBN-13 : 978-0073401836
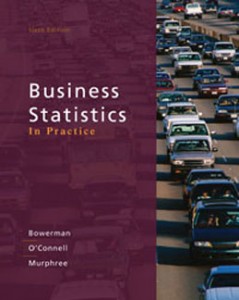
- Author: Bruce L. Bowerman; Richard T. O’Connell
The new edition of Business Statistics in Practice provides a modern, practical, and unique framework for teaching the first course in business statistics. This framework features case study and example-driven discussions of all basic business statistics topics. In addition, the authors have rewritten many of the discussions in this edition and have explained concepts more simply from first principles. The only prerequisite for this text is high school algebra.
Table of contents:
An Introduction to Business Statistics
Data
3(2)
Data Sources
5(2)
Populations and Samples
7(1)
Three Case Studies That Illustrate Sampling and Statistical Inference
8(6)
Ratio, Interval, Ordinal, and Nominative Scales of Measurement (Optional)
14(4)
Getting Started with Excel
18(5)
Getting Started with MegaStat
23(4)
Getting Started with MINITAB
27(8)
Descriptive Statistics: Tabular and Graphical Methods
Graphically Summarizing Qualitative Data
35(7)
Graphically Summarizing Quantitative Data
42(12)
Dot Plots
54(2)
Stem-and-Leaf Displays
56(5)
Cross-tabulation Tables (Optional)
61(6)
Scatter Plots (Optional)
67(3)
Misleading Graphs and Charts (Optional)
70(10)
Tabular and Graphical Methods Using Excel
80(8)
Tabular and Graphical Methods Using MegaStat
88(4)
Tabular and Graphical Methods Using MINITAB
92(9)
Descriptive Statistics: Numerical Methods
Describing Central Tendency
101(9)
Measures of Variation
110(10)
Percentiles, Quartiles, and Box-and-Whiskers Displays
120(9)
Covariance, Correlation, and the Least Squares Line (Optional)
129(5)
Weighted Means and Grouped Data (Optional)
134(5)
The Geometric Mean (Optional)
139(7)
Numerical Descriptive Statistics Using Excel
146(3)
Numerical Descriptive Statistics Using MegaStat
149(2)
Numerical Descriptive Statistics Using MINITAB
151(4)
Probability
The Concept of Probability
155(2)
Sample Spaces and Events
157(7)
Some Elementary Probability Rules
164(7)
Conditional Probability and Independence
171(11)
Bayes’ Theorem (Optional)
182(3)
Counting Rules (Optional)
185(10)
Discrete Random Variables
Two Types of Random Variables
195(1)
Discrete Probability Distributions
196(11)
The Binomial Distribution
207(10)
The Poisson Distribution (Optional)
217(6)
The Hypergeometric Distribution (Optional)
223(5)
Binomial and Poisson Probabilities Using Excel
228(2)
Binomial and Poisson Probabilities Using MegaStat
230(1)
Binomial and Poisson Probabilities Using MINITAB
231(2)
Continuous Random Variables
Continuous Probability Distributions
233(2)
The Uniform Distribution
235(3)
The Normal Probability Distribution
238(18)
Approximating the Binomial Distribution by Using the Normal Distribution (Optional)
256(4)
The Exponential Distribution (Optional)
260(3)
The Normal Probability Plot (Optional)
263(7)
Normal Distribution Using Excel
270(1)
Normal Distribution Using MegaStat
271(1)
Normal Distribution Using MINITAB
272(3)
Sampling and Sampling Distributions
Random Sampling
275(4)
The Sampling Distribution of the Sample Mean
279(13)
The Sampling Distribution of the Sample Proportion
292(3)
Stratified Random, Cluster, and Systematic Sampling (Optional)
295(2)
More about Surveys and Errors in Survey Sampling (Optional)
297(8)
Generating Random Numbers Using Excel
305(1)
Generating Random Numbers Using MegaStat
306(1)
Generating Random Numbers and Simulating Sampling Distributions Using MINITAB
306(3)
Confidence Intervals
z-Based Confidence Intervals for a Population Mean: & Known
309(9)
t-Based Confidence Intervals for a Population Mean: & Unknown
318(7)
Sample Size Determination
325(4)
Confidence Intervals for a Population Proportion
329(7)
Confidence Intervals for Parameters of Finite Populations (Optional)
336(5)
A Comparison of Confidence Intervals and Tolerance Intervals (Optional)
341(5)
Confidence Intervals Using Excel
346(1)
Confidence Intervals Using MegaStat
347(1)
Confidence Intervals Using MINITAB
348(3)
Hypothesis Testing
The Null and Alternative Hypotheses and Errors in Hypothesis Testing
351(6)
z Tests about a Population Mean: & Known
357(11)
t Tests about a Population Mean: & Unknown
368(5)
z Tests about a Population Proportion
373(5)
Type II Error Probabilities and Sample Size Determination (Optional)
378(6)
The Chi-Square Distribution (Optional)
384(1)
Statistical Inference for a Population Variance (Optional)
385(7)
One-Sample Hypothesis Testing Using Excel
392(1)
One-Sample Hypothesis Testing Using MegaStat
393(1)
One-Sample Hypothesis Testing Using MINITAB
394(3)
Statistical Inferences Based on Two Samples
Comparing Two Population Means by Using Independent Samples: Variances Known
397(6)
Comparing Two Population Means by Using Independent Samples: Variances Unknown
403(8)
Paired Difference Experiments
411(8)
Comparing Two Population Proportions by Using Large, Independent Samples
419(6)
Comparing Two Population Variances by Using Independent Samples
425(11)
Two-Sample Hypothesis Testing Using Excel
436(1)
Two-Sample Hypothesis Testing Using MegaStat
437(2)
Two-Sample Hypothesis Testing Using MINITAB
439(4)
Experimental Design and Analysis of Variance
Basic Concepts of Experimental Design
443(3)
One-Way Analysis of Variance
446(11)
The Randomized Block Design
457(8)
Two-Way Analysis of Variance
465(16)
Experimental Design and Analysis of Variance Using Excel
481(1)
Experimental Design and Analysis of Variance Using MegaStat
482(2)
Experimental Design and Analysis of Variance Using MINITAB
484(5)
Chi-Square Tests
Chi-Square Goodness of Fit Tests
489(9)
A Chi-Square Test for Independence
498(11)
Chi-Square Tests Using Excel
509(2)
Chi-Square Tests Using MegaStat
511(2)
Chi-Square Tests Using MINITAB
513(4)
Simple Linear Regression Analysis
The Simple Linear Regression Model and the Least Squares Point Estimates
517(13)
Model Assumptions and the Standard Error
530(3)
Testing the Significance of the Slope and y-Intercept
533(7)
Confidence and Prediction Intervals
540(6)
Simple Coefficients of Determination and Correlation
546(5)
Testing the Significance of the Population Correlation Coefficient (Optional)
551(1)
An F Test for the Model
552(3)
The QHIC Case
555(2)
Residual Analysis
557(10)
Some Shortcut Formulas (Optional)
567(9)
Simple Linear Regression Analysis Using Excel
576(1)
Simple Linear Regression Analysis Using MegaStat
577(2)
Simple Linear Regression Analysis Using MINITAB
579(2)
Multiple Regression
The Multiple Regression Model and the Least Squares Point Estimates
581(10)
Model Assumptions and the Standard Error
591(2)
R2 and Adjusted R2
593(2)
The Overall F Test
595(2)
Testing the Significance of an Independent Variable
597(4)
Confidence and Prediction Intervals
601(3)
The Sales Territory Performance Case
604(2)
Using Dummy Variables to Model Qualitative Independent Variables
606(12)
The Partial F Test: Testing the Significance of a Portion of a Regression Model
618(3)
Residual Analysis in Multiple Regression
621(7)
Multiple Regression Analysis Using Excel
628(2)
Multiple Regression Analysis Using MegaStat
630(2)
Multiple Regression Analysis Using MINITAB
632(3)
Model Building and Model Diagnostics
The Quadratic Regression Model
635(7)
Interaction
642(6)
Logistic Regression
648(4)
Model Building and the Effects of Multicollinearity
652(13)
Improving the Regression Model I: Diagnosing and Using Information about Outlying and Influential Observations
665(6)
Improving the Regression Model II: Transforming the Dependent and Independent Variables
671(7)
Improving the Regression Model III: The Durbin-Watson Test and Dealing with Autocorrelation
678(10)
Model Building Using Excel
688(2)
Model Building Using MegaStat
690(2)
Model Building Using MINITAB
692(5)
Time Series Forecasting
Time Series Components and Models
697(1)
Time Series Regression: Basic Models
698(6)
Time Series Regression: More Advanced Models (Optional)
704(4)
Multiplicative Decomposition
708(7)
Simple Exponential Smoothing
715(5)
Holt-Winters’ Models
720(9)
Forecast Error Comparisons
729(1)
Index Numbers
730(9)
Time Series Analysis Using Excel
739(1)
Time Series Analysis Using MegaStat
740(2)
Time Series Analysis Using MINITAB
742(3)
Process Improvement Using Control Charts
Quality: Its Meaning and a Historical Perspective
745(4)
Statistical Process Control and Causes of Process Variation
749(2)
Sampling a Process, Rational Subgrouping, and Control Charts
751(5)
X and R Charts
756(16)
Pattern Analysis
772(5)
Comparison of a Process with Specifications: Capability Studies
777(8)
Charts for Fraction Nonconforming
785(6)
Cause-and-Effect and Defect Concentration Diagrams (Optional)
791(8)
Control Charts Using MegaStat
799(1)
Control Charts Using MINITAB
800(4)
Nonparametric Methods
The Sign Test: A Hypothesis Test about the Median
804(4)
The Wilcoxon Rank Sum Test
808(6)
The Wilcoxon Signed Ranks Test
814(4)
Comparing Several Populations Using the Kruskal-Wallis H Test
818(2)
Spearman’s Rank Correlation Coefficient
820(6)
Nonparametric Methods Using MegaStat
826(3)
Nonparametric Methods Using MINITAB
829(4)
Decision Theory
Introduction to Decision Theory
833(6)
Decision Making Using Posterior Probabilities
839(8)
Introduction to Utility Theory
847(5)
Appendix A Statistical Tables
852(25)
Appendix B Properties of the Mean and the Variance of a Random Variable, and the Covariance
877(3)
Appendix C Derivations of the Mean and Variance of x and p
880(2)
Appendix D Answers to Most Odd-Numbered Exercises
882(8)
Appendix E References
890(2)
Photo Credits
892(1)
Index
893
People also search:
Business Statistics in Practice
Business Statistics in Practice Bowerman
Business Statistics in Practice Bowerman 6th
Business Statistics in Practice Bowerman 6th Test Bank
Test Bank for Business Statistics in Practice, 6th Edition: Bowerman Download
Related products
Test Bank
Test Bank for Essentials of Business Law and the Legal Environment, 11th Edition: Richard A. Mann


